Why like this?5 min read
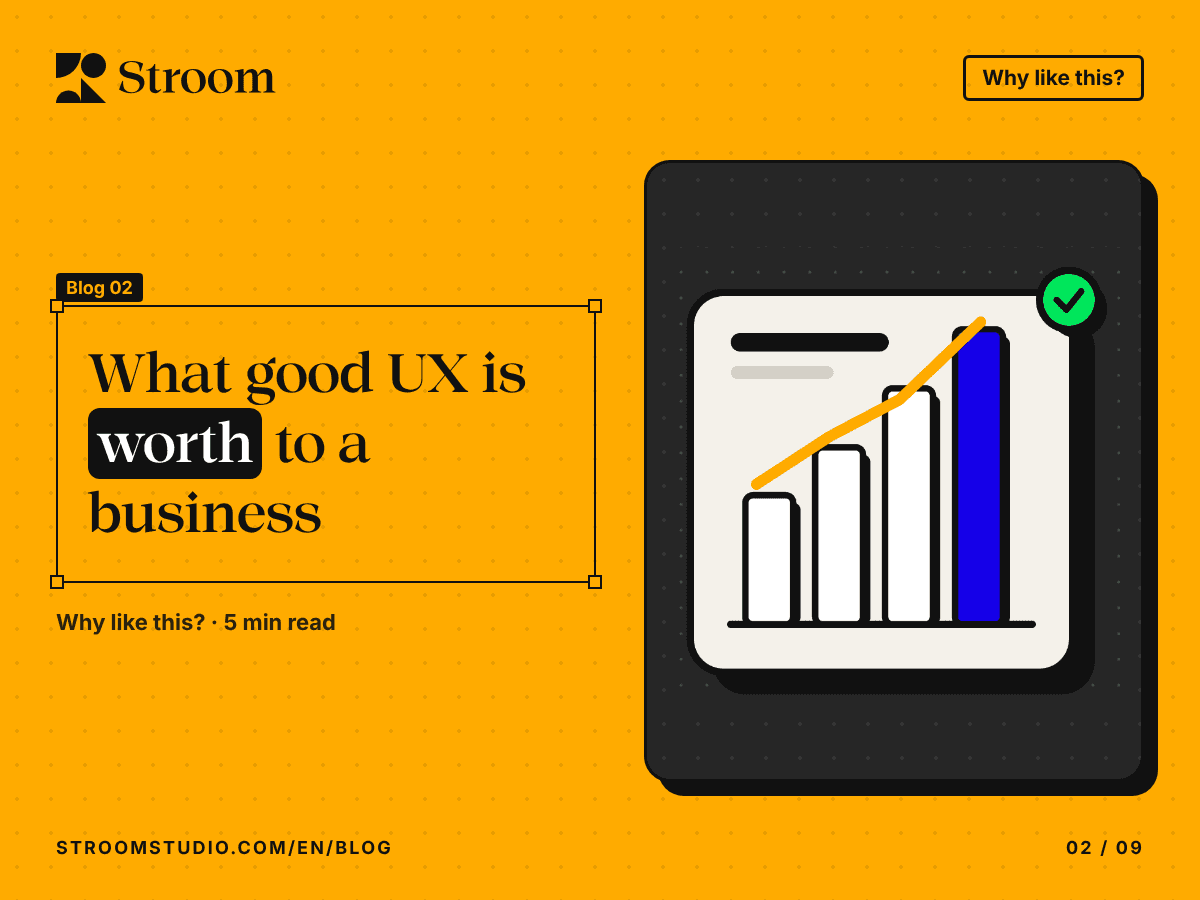
What good UX is worth to a business

What McKinsey, Baymard and Forrester actually measured about UX and conversion, revenue, support costs, rework and retention.
You fill a basket on a shopping site, press “Checkout”, and the site asks you to create an account first. You close the tab and buy somewhere else. Nobody at that company sees you leave; they only see lower sales.
The gap between what a business builds and what people actually manage to do with it is the territory of user experience (UX): how easy a product is to understand and use, from the first visit to the last. Spending on UX is often treated as polish. The research says otherwise, if you read it carefully.
Conversion: fewer people give up halfway
Baymard Institute, which has tested checkout usability on large US and European retailers for more than ten years, keeps a list of studies on online cart abandonment. Across 50 studies, the average documented abandonment rate is 70.22%. Put plainly, about seven in ten baskets are left behind.
Some of that is just browsing, but some is pure design. In Baymard’s research, 17% of US online shoppers said they had abandoned an order because the checkout was too long or complicated. Being made to create an account appears on the same list of reasons, at 18%.
Baymard estimates that the average large ecommerce site could raise its conversion rate by 35.26% through better checkout design. Conversion rate is the share of visitors who complete a purchase. It is an estimate built from problems Baymard found solvable in its testing, not a promise for any one site.
How large are design gains in general? Nielsen Norman Group collects before-and-after metrics from redesign projects. Across 99 case studies, the average improvement was 247% for projects collected in 2006 to 2008, and 75% for those collected in 2020. The author links the drop to the industry fixing its most obvious problems, not to the work mattering less.
Revenue: what McKinsey measured
In 2018 McKinsey published “The business value of design”. The team tracked the design practices of 300 publicly listed companies over five years in three industries: medical technology, consumer goods and retail banking. They gathered more than two million pieces of financial data and recorded more than 100,000 design actions.
From this they identified 12 design actions most closely linked to better financial performance, grouped into four themes, one of which is user experience. They combined them into a score, the McKinsey Design Index. Companies in its top quartile had 32 percentage points higher revenue growth and 56 percentage points higher total returns to shareholders than their industry peers between 2013 and 2018.
This is a correlation, not proof that design alone caused the growth. The study also showed how much room there is. More than 40% of the companies surveyed were not talking to their end users during development, and only about half did any user research before producing their first design ideas.
Rework: mistakes are cheaper before they are built
Rework means rebuilding something because it turned out to be wrong. It costs time and money twice, and it often starts with a team guessing what users need.
In 2018 Forrester Consulting published a Total Economic Impact study of IBM’s design thinking practice, commissioned by IBM. Design thinking here means a way of working that puts end users at the centre of the design process. Forrester modelled a composite organisation based on interviews with four IBM clients and a survey of 60 executives. Over three years it found that:
- the time needed for design and alignment fell by 75%
- development and testing time fell by 33%, which Forrester attributes to better design and a clearer understanding of users
- design defects were cut in half
- the return on investment was 301%
Read these as one model paid for by the vendor, not a benchmark for your company. The direction is what matters: understanding users first means building fewer wrong things.
Support: a confusing screen becomes a phone call
When people cannot do something on their own, they contact you. In a 2016 Nielsen Norman Group diary study of 45 customer journeys, such as opening a bank account or shopping for insurance, 64% included at least one contact with the organisation that the customer started. The author notes that contacting customer service “often reflects a UX failure”.
Each contact costs money. In 2007 Jakob Nielsen put the cost of answering a single phone call at $10 to $100, depending on the qualifications of the staff. The international standard for human-centred design, ISO 9241-210, makes the same point in general terms: support and help-desk costs fall when people can understand and use a product without extra help.
Retention: people come back to what works
Retention means customers who stay, or come back. Forrester’s 2024 US Customer Experience Index, based on more than 98,000 US customers across 223 brands, reports that organisations it describes as customer-obsessed see 51% better customer retention and 41% faster revenue growth than organisations that are not. Customer experience covers every contact with a brand, so it is wider than UX, and this too is a correlation. Still, a product that people struggle with gives them a reason to leave.
The takeaway
Good UX shows up in numbers a business already tracks: completed orders, support calls, features rebuilt and customers who return. Pick one journey that matters, measure it before you change it, then measure it again afterwards. That is the order Stroom works in: understand, measure, decide, then build.
Sources
- 50 Cart Abandonment Rate Statistics, Baymard Institute, 2025
- Average UX Improvements Are Shrinking Over Time, Nielsen Norman Group, 2020
- The business value of design, McKinsey & Company, 2018
- The Total Economic Impact of IBM’s Design Thinking Practice, Forrester Consulting (commissioned by IBM), 2018
- Minimize the Need for Customer Service to Improve the Omnichannel UX, Nielsen Norman Group, 2016
- Do Government Agencies and Non-Profits Get ROI From Usability?, Nielsen Norman Group, 2007
- ISO 9241-210:2019, Human-centred design for interactive systems, ISO, 2019
- Forrester’s 2024 US Customer Experience Index, Forrester, 2024